
giailang
Well-Known Member
Với các trader và analyst, thị trường chia thành các loại:
1/ Có xu hướng: Giá đi lên hoặc xuống rõ ràng, mặc dù có thể dao động quanh một trục nào đó
2/ Giá chạy trong khỏang: Đồ thị chạy trong một hình chữ nhật mà cạnh trên là R, cạnh dưới là S. Nếu khỏang cách giữa giới hạn trên và dưới quá gần, người ta gọi là choppy.
3/ Giá dao động trong khỏang hẹp không xác định cận trên, dưới theo quy luật rõ ràng
Trong bài này tôi giới thiệu chỉ báo CHOPPY MARKET INDEX trên MQ4 (sưu tầm)
The Indicator Series : The Choppy Market Index an Answer to the “trend/range” Question Daniel Fernandez.
Is the market trending or range trading ? This is one of the most common questions you will hear people ask when using technical analysis tools. Certainly there are many ways in which indicators can tell you if in the past the market was ranging or trending on a given instrument, tools that can be used for this are the RSI, ADX, Stochastic oscillator, etc. However the most important question comes when we attempt to predict some type of future behavior after we conclude that the market has been trending/ranging for a given period of time. On today’s post on the indicator series – a collection of posts I have created to explain the nature and uses of indicators in mechanical trading – I will talk about the Choppy Market Index, a very unknown yet quite useful indicator that gives us a very transparent way to see if the market has been ranging or trending. By evaluating the information the indicator tells us I will suggest several ways in which it can be used to create long term profitable systems.
Despite my efforts to find who created this indicator I was unable to find information about the author. I was in fact introduced to this indicator by the book “Building Winning Trading Systems with Trade Station” by Geroge Pruitt and John R. Hill, a book detailing the creation of several systems for the futures market using the Trade Station platform. Overall this book gives a good introduction to Trade Station coding and the building of long term trend following strategies (alike the turtle trading system) and one of the things I found most interesting when I read this a few years ago was the use of the Choppy Market Index, although much better uses came to mind later on.
The Choppy Market Index (CMI) is actually a very simple indicator which compares the difference between the close of the current period with the close X periods ago and normalizes this against the range (highest – lowest) of that period. The value of the indicator is finally multiplied by 100 to give a number between 0 and 100. The formula of the indicator is highlighted below :
CMI = ((|Close Current period – Close X periods in the past|)/(Highest point in X periods – Lowest point in X periods))*100
If you see the indicator simply tells us how much the market has moved compared to how much it has “wandered”, it gives us a good idea of how much the instrument has actually moved within the past X periods compared to its overall “volatility”. The good thing about this indicator is that it is a very straightforward measurement of congestion, low values of the CMI indicate that the market hasn’t moved almost anywhere for the past X periods while high values indicate that the market has trended strongly.
-
-
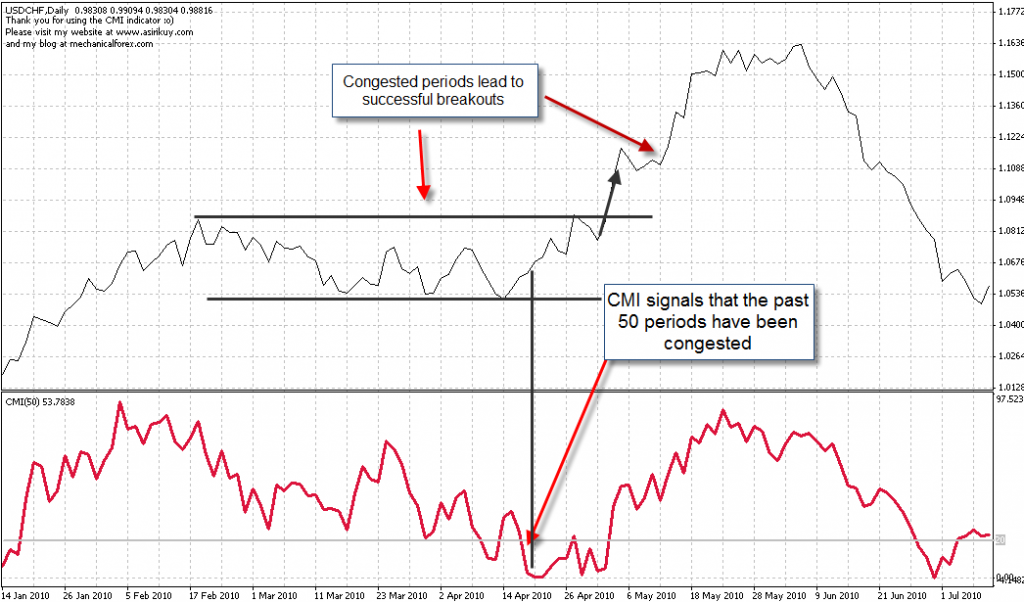
The important thing here is to realize that the CMI should not be used as a tool to predict the continuation of a given market behavior because such an approach is bound to fail. The CMI only tells you information about the past so when it gives you a measurement below 20 (implying that the market has only closed 20% of the range it has walked for the past X periods, it is ranging) it simply tells you that the past has been a congested zone. In order to take advantage of this information we need to analyze what it implies. Low values of the CMI – especially on high periods (50) on higher charts like the daily – imply that the market has been very congested for a given period of time and very successful breakouts usually follow periods of increased congestion. The CMI can therefore work as a tool to build a breakout strategy since it is very good for measuring “accumulation patterns”.
-

-
When the CMI is high we also have an advantage since it tells us that the market is prone to retrace. When the CMI is close to 100 it implies that the market has closed almost all the movement it has made, implying that the market should retrace with a significant probability. The higher the period of the CMI and the higher the value the more “over-extended” a given trend is. Of course care must be taken when building such counter-trending mechanisms but the CMI clearly shows you how you can build a trending-(counter-trending) full system using a single indicator. When the CMI shows a congested market we expect breakouts and when it has a high value we expect retracements. Of course we will need to take into account many other things to build a trading strategy but this information shows you how to use the CMI properly and why it is not bound to succeed when used as a tool to predict continuations. Other tactics, like using the indicator to determine trend establishment and then entering upon retracements are also obviously possible.
The CMI is not very easy to find (I couldn’t find any MQL4 implementation) so I have coded a small free version of the indicator for MT4 you can download here.
If you would like to learn more about mechanical trading and how you too can build your own likely long term profitable systems based on sound trading tactics please consider joining Asirikuy.com, a website filled with educational videos, trading systems, development and a sound, honest and transparent approach to automated trading in general . I hope you enjoyed this article ! :o)